Introduction:
The common practise amongst anglers to either deposit, discharge or eject the lead weight, either during the take or during the fight, has become a topic of contention amongst the angling community.
This has led to many assumptions, leading to accepted belief and in turn led to a rise in virtue signalling, regarding the dropping of leads. The main assumption being that an ounce of lead dropped is an ounce of lead to dissolve in the water course. THIS IS SIMPLY NOT THE CASE and is a misleading perception that is mostly driving this emotional subject. My subsequent aim is to remove all of that emotion and replace it with cold, hard, scientific facts.
There are three distinct camps; The ‘environmentalist’ anglers (aren’t we all?) who vehemently condemn such lead dropping practises, the sceptical angler who believes there is no issue with discharging or ejection of leads and the third camp, made of anglers who simply do not think about or worry themselves about the subject and simply want to go fishing.
Within this piece I intend to share some of the simple research I have performed to try and settle the debate, if not for my own inquisitive purposes, but to hopefully add weight (see what I did there?) to either side of the discussion, depending on the outcome of the data.
First of all, we need to understand exactly what it is we need a weight to do for us in the first place. In the simplest form, it is used as a casting aid, to get the bait the distance needed to reach feeding fish. As angling methods have evolved, in particular the popularity of the Bolt Rig, the size of lead weights commonly used have increased over the years. It is now not uncommon to find anglers using 4oz plus lead with regularity. Some anglers also regularly use much heavier weights than this, depending on the circumstances they might be angling in, such as long range fishing on a windswept venue or fishing strong flowing rivers.
Lead Discharge Process:
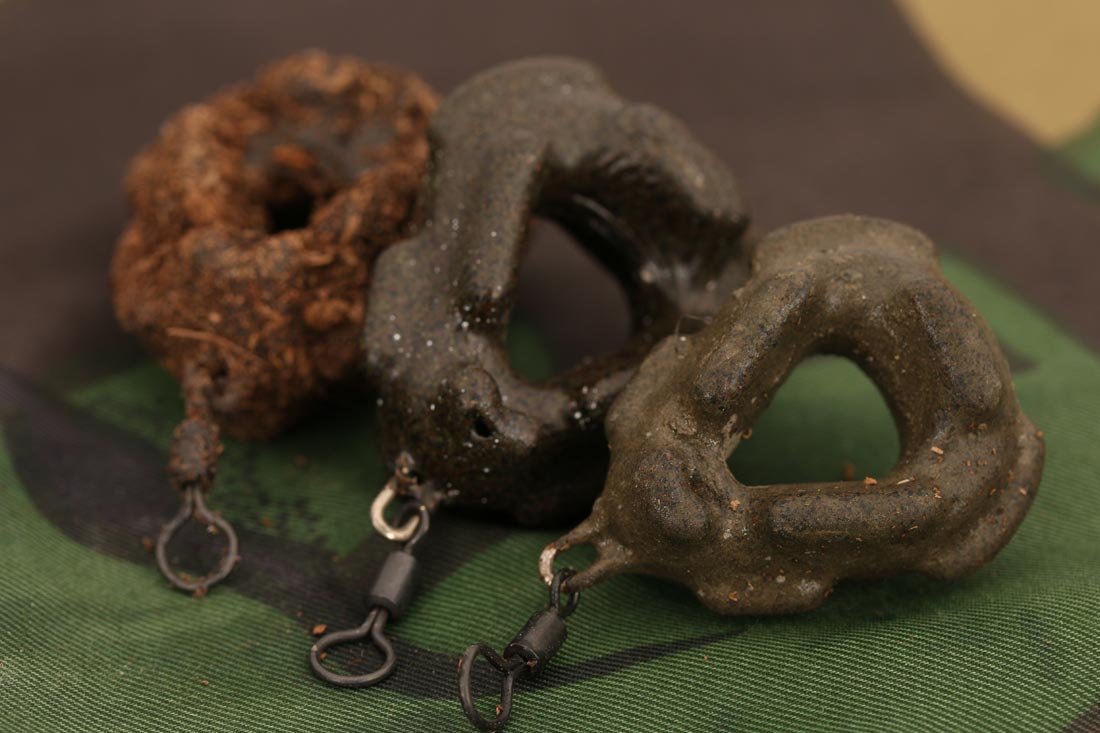
The typical lead discharge process has evolved due to several combining factors. One of these factors is the prevalence of ‘lead clips’ in modern rigs, which are designed to safely eject the weight in the event of snagging on the bottom or an obstacle. Their effect can be further enhanced by positioning the tail rubber at the rear of the clip, or simply cut the retaining lug down to aid ejection. Another factor is the rise of the ‘drop off inline’ method, whereby the lead is purposely mounted to fall off upon the take.
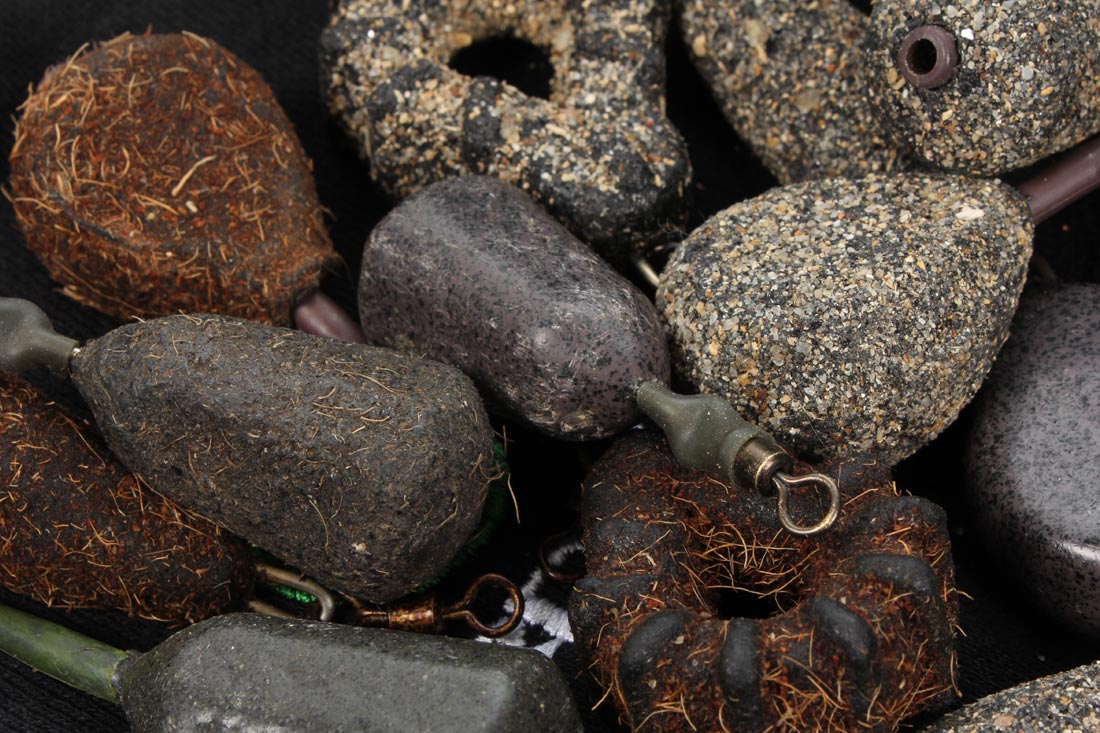
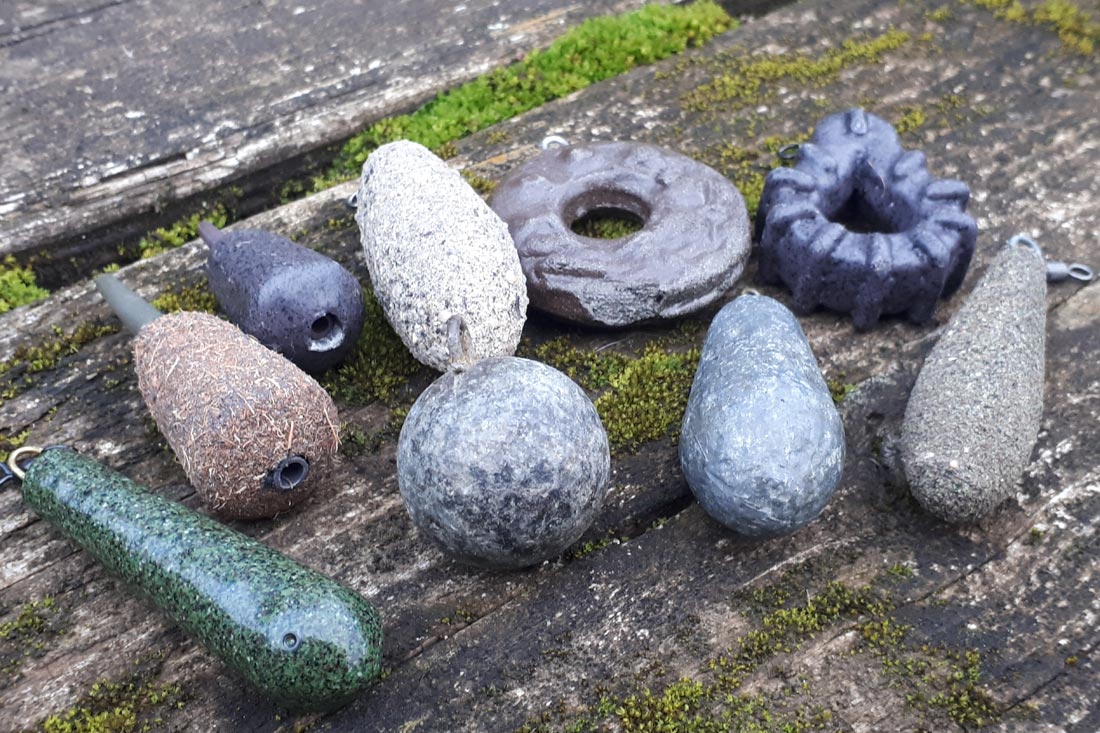
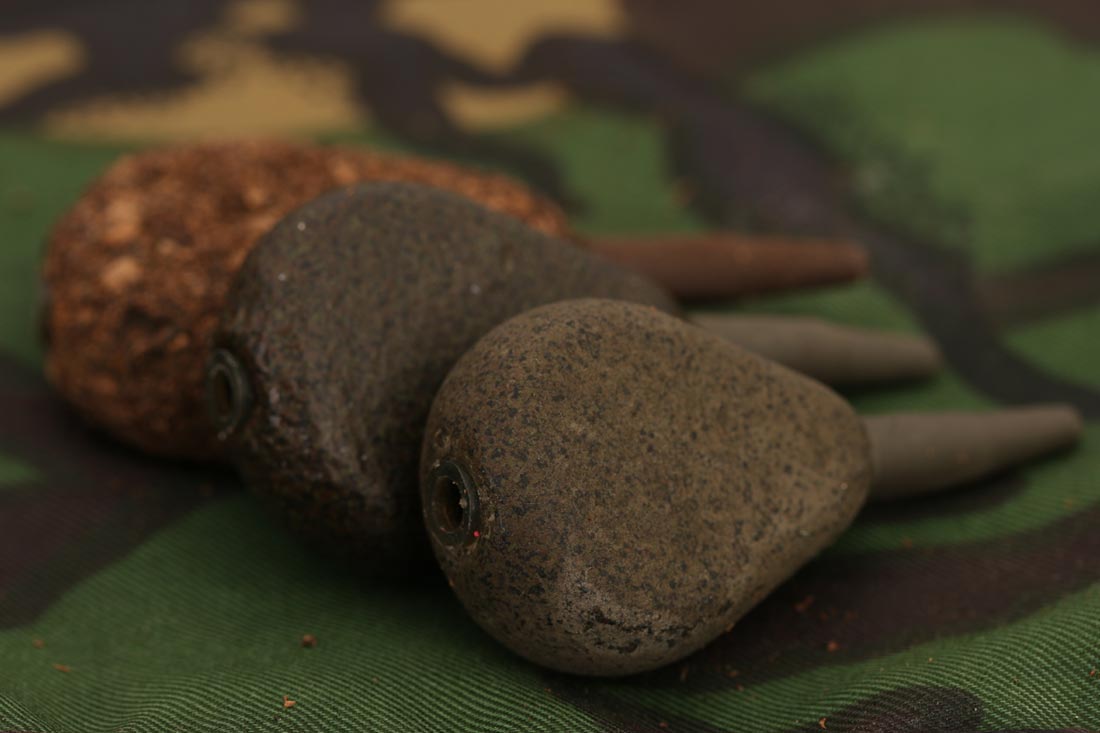
Leads can take on several forms, but (estimated following a brief canvassing period) 80% of fishing weights used and possibly discharged have some form of baked on plastic coating. This will prevent ingress of water as far as practically possible, splits and lesions in the coating aside, and potentially eliminate the formation of lead oxidisation scales.
Research:
After easily locating and eventually digesting a report entitled: ‘Effect of pH on the concentrations of lead and trace contaminants in drinking water: A combined batch, pipe loop and sentinel home study’ by the Department of Civil and Environmental Engineering, University of Western Ontario 2011, I have isolated the following observable and measurable points:
- Lead oxidisation/corrosion scale is the cause of possible dissolved lead (pb) content in water.
- Most lead concentration found in water is in the form of oxidisation particulates.
- Experiments were performed via the dissolution kinetic method, on the harvested corrosion scale at the pH ranges of 6, 7, 8, 9 and 10.
- Measurements were taken over periods of 30 minutes, 1, 3, 6 and 12 hours and 1, 2, 3, 5, 7, 10, 15, 20 and 30 days.
The most dissolved lead content in water will occur within the first half an hour. Any increase in time does not see an increased level of solubility. What is of interest to the freshwater angler, is that the higher the pH level, the less dissolved lead is present. To the point that at higher pH levels, only background lead levels are detectable. For reference, the CDC safe limit for lead in drinking water is 15,000 ppm (parts per million). This is over 3 times lower than the measured rate of lead dissolution in the above investigation, at a pH of 6.
Therefore, high pH (alkaline) levels above 7 will inhibit any lead corrosion scales from dissolving. However, as we move down the acidic scale, past ‘neutral’ 7 pH towards a pH of 6, we notice that there is much more dissolved lead in the measured samples, up to 50,000 micrograms per litre (50,000 ppm).
This was also confirmed in the following independent report:
Water Chemistry Effects on Dissolution Rates of Lead Corrosion Products [Project #4064] PRINCIPAL INVESTIGATORS: Daniel E. Giammar, Katherine S. Nelson, James D. Noel, and Yanjiao Xie
More data can be found on the Lenntech website: http://www.lenntech.com/periodic/water/lead/lead-and-water.htm
Snippet here:
Lead (Pb) and water
Lead and water: reaction mechanisms, environmental impact and health effects
Seawater contains trace amounts of lead (2-30 ppt). On average rivers contain between 3 and 30 ppb. Phytoplankton contains approximately 5-10 ppm lead (dry mass), freshwater fish approximately 0.5-1000 ppb, and oyster approximately 500 ppb.
The World Health Organization (WHO) stated a legal limit of 50 ppb for lead in 1995, which was decreased to 10 ppb in 2010.
In what way and in what form does lead react with water? Under normal conditions lead does not react with water. However, when lead comes in contact with moist air reactivity with water increases. A small lead oxide (PbO) layer forms at the surface of the metal. When both oxygen and water are present, metallic lead is converted to lead hydroxide (Pb(OH)2): 2Pb(s)+ O2(g) + 2H2O(l) -> 2 Pb(OH)2(s)
Read more: http://www.lenntech.com/periodic/water/lead/lead-and-water.htm#ixzz4q6bqnbkx
Another question worth answering is: How much will lead actually oxidise in water? Air is made of 20.3% oxygen, yet water is generally 0.001% oxygen. So encapsulating lead in water is going to mitigate the oxidisation effect by a large proportion. Corrosion of lead in water is summarised by the following statement from a document titles ‘Properties of Lead’ found on the International Lead Association website. www.ila-lead.org
‘Control of corrosion reactions In practice, the corrosion of lead is often controlled by its reaction products (lead salts) building up on the surface of the metal. Many of these salts have very low solubilities in water, particularly lead sulphate, carbonate and chromate. If they form a barrier which covers the whole surface, and the barrier is not damaged, the rate of corrosion is greatly reduced.’
We have now established that a pH lower than 6 and decreasing will lead to the exponential dissolution rate of lead oxidisation scales. This is NOT THE LEAD ITSELF which is actually insoluble as detailed above. What I now needed to understand was the general pH levels of freshwater water courses and what their natural range of pH fluctuation is, what causes it and how fish react to these changes. This is to establish if lead scale dissolution will actually cause a problem.
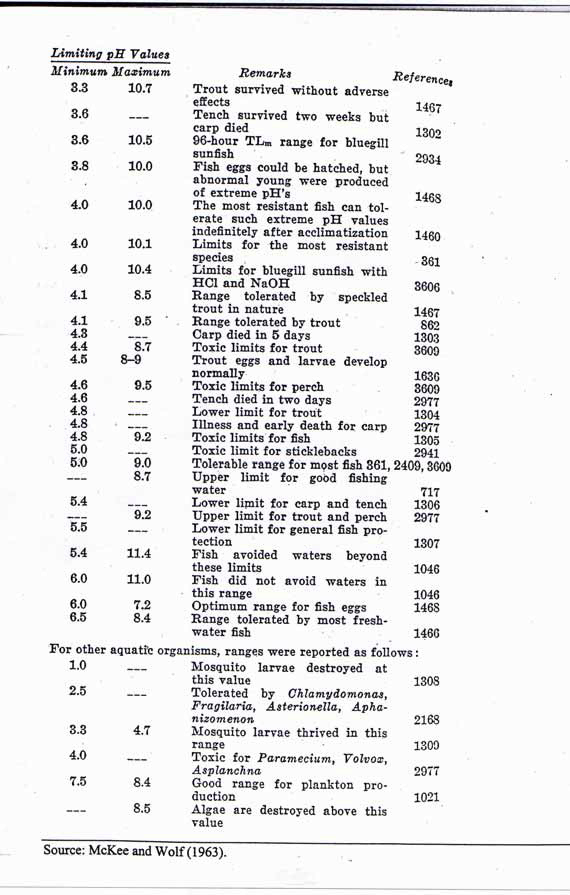
To fully understand the relevance of the effect of pH on freshwater biology, I referred to a document titled: ‘PH REQUIREMENTS OF FRESHWATER AQUATIC LIFE, prepared by Robertson Bryan Inc’, who specialise in water and power resources. They note that carp will die within days in water with a pH of 4.3, and all fish life is devoid even tench, once you reach a pH of 3. So the fact fish are healthy, eating and swimming about their daily business indicates the water pH level is nearer to 7, which has significantly less lead dissolving capability.
Quote:
‘Below a pH of 5.0, mortality occurs in some life stages of certain fish species, although some fishes can be acclimated to pH levels below 4.0. Certain species of macroinvertebrates can tolerate very low pH values. Lackey (1938) found Gammarus spp. in two streams with pH values of 2.2 and 3.2, mosquito larvae in a stream at pH 2.4, and caddis fly larvae (Trichoptera) at pH 2.4. Nevertheless, the primary productivity of freshwater aquatic ecosystems is reduced considerably below pH 5.0, which, in turn, reduces the food supply for higher organisms. Hence, fish that remain present would likely experience reduced numbers and/or growth rates (Alabaster and Lloyd 1980).’
The below image details the results as measured/observed by McKee and Wolf in 1963:
The next piece of the puzzle was to establish what these natural variances in pH are, as found in freshwater, both flowing and still.
Freshwater gravel pits are characterised by their method of construction, as in a hole is dug for aggregate, then allowed to fill through a combination of ingress through the water table and precipitation. Referring to ‘Groundwater and surface water interaction in flow-through gravel pit lakes’ by the University of Bologna and the VU University of Amsterdam 2015’, I learned that:
‘Hydrochemical analysis of ground- and surface waters, as well as chemical analysis of lake bottom sediments and stable H and O isotope data, show that gravel pit lake water is characterized (among others) by a higher pH, O2 and alkalinity and lower dissolved metal and certain trace concentrations than natural lakes and groundwater’.
Gravel pits in the northern hemisphere will typically have a pH level in the range of 6.5 to 7.5, with rivers having a mean pH in the range of 7 to 8, so higher than a gravel pit. Harry Haskell rightly mentioned the effect silt, and it’s acidic effects on a water body. Having failed to locate much information regarding the acidic effects of accumulated and decomposed silt in a gravel pit, I did eventually locate a research paper titled: ‘Acidification of groundwater in water-filled gravel Pits, a new environmental and geomedical threat’ written by the Institute of Geosciences and Astronomy, University of Oulu, Finland 1997. The salient statement for me from that particular publication was thus:
‘Anomalously low pH values in the water of gravel pits can result from (1) the use of the pits as dumping sites for acidic waste, (2) acid rain, (3) acid rain combined with prolonged and enhanced evaporation, (4) flow, seepage or percolation of acidic peat-bog water into the pits from the surrounding wetlands, or (5) the chemical weathering of sulphides to sulphates and sulphuric acid, enhanced by the oxidative conditions occasioned by the removal of the overburden in association with the use of gravel and other materials from the esker for construction purposes’.
Not having the data to pinpoint acidic waste dumping sites, I cannot conclude that my local waters have not been used for such purposes, either today or in the past. Acid rain is a phenomenon known to plague North America and Scandinavia, but various clean air acts have mitigated this issue in recent years. For the purpose of this piece, I will proceed with risk to my results that acid rain has no or minimal effect on UK waterways.
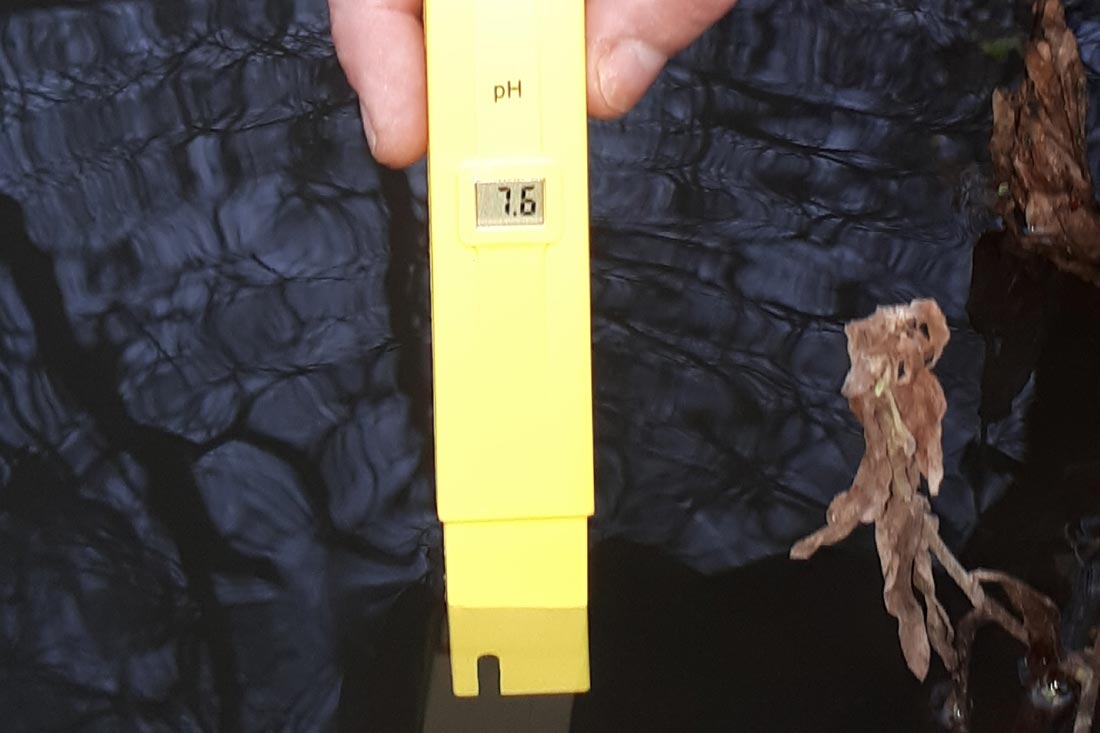
Fish blood has a pH of 7.4, so it stands to reason that the optimal pH for a freshwater course will be 7.4, which is nowhere near the pH value required to dissolve oxidisation scales that have formed on a lead surface.
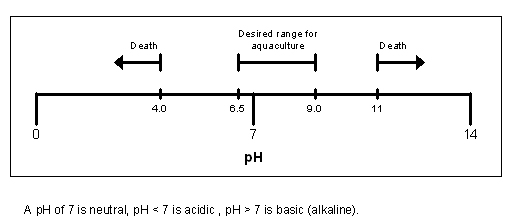
Diagram showing the effect of pH on Aquaculture:
Silt:
Another curve ball is the provision for potentially acidic composition of freshwater silt. This is made up of detritus, including CO2 forming decaying plant matter, such as dead weed or leaves. This effect is misleading though, as the entire water base pH will vary throughout the day depending on photosynthesis amounts and water temperature stratification. Large ponds and lakes tend to be stable with regards to pH and any fluctuations that may occur do so over a long time.
Summary:
I admit there is a lot of detail included in the above few paragraphs. To summarise I will list the following points:
1. LEAD DOES NOT DISSOLVE IN WATER. Otherwise they would not use it as flashing on roofs.
2. Lead contamination in water is observed to be in the form of corrosion/oxidisation scales that have formed on the lead surface.
3. These scales dissolve at pH ranges of 6 or less, increasing exponentially as the pH decreases beyond 5.
4. Most freshwater environments we are likely to encounter as anglers have a pH range of 6.5 to 8, with gravel pits generally being higher in pH to rivers.
5. At a pH range of 5 or below, most fish species, including carp (with the apparent exception of tench) will die in a matter of days.
Therefore I will conclude that:
- The leads I use will not form oxidisation scales as they are coated. Even if uncoated, the limits of oxidisation are next to negligible.
- If the coating is breached, the amount of oxidisation on the surface can possibly be measured in ppt (parts per trillion) in relation to the water body. The CDC safe limit for lead in drinking water is 15,000 ppm (parts per million) which is backed up by the WHO, which lowered the limit to 10,000ppm in 2010.
With the bulk of my angling being performed on either Berkshire/Bucks/Oxfordshire gravel pits or rivers (Thames, Loddon, Colne, Kennet etc), I can, and will, fish safe in the knowledge that the predominant environmental conditions in my local venues does not contribute to increased levels of dissolved lead, if I so happen to discharge a lead weight during the course of my angling. This is not to say that it will not happen at all, but the scientific information I have located so far indicates that my personal angling situation is as mitigated as far as naturally possible, to the reduction of lead dissolution.
Appendix/Resources:
Acidification of groundwater in water-filled gravel pits ± a new environmental and geomedical threat
Risto Piispanen* and Tuija Nykyri
Institute of Geosciences and Astronomy, University of Oulu, FIN-90570 Oulu, Finland
pH, the CO2 system and freshwater science. JF Talling. 2010
Water Chemistry Effects on Dissolution Rates of Lead Corrosion
Products [Project #4064] ORDER NUMBER: 4064
DATE AVAILABLE: Summer 2010
PRINCIPAL INVESTIGATORS: Daniel E. Giammar, Katherine S. Nelson, James D. Noel, and Yanjiao Xie
Groundwater and surface water interaction in flow-through gravel pit lakes.
Pauline Nella Mollema (1,2) and Marco Antonellini (1)
(1) University of Bologna, Department of Biological, Geological and Environmental Sciences, Italy (pmollema@gmail.com),
(2) VU University Amsterdam, Department of Earth and Life Sciences, The Netherlands. (pmollema@gmail.com)
Effect of pH on the concentrations of lead and trace contaminants in drinking water: A combined batch, pipe loop and sentinel home study
Eun Jung Kim a, Jose E. Herrera a,*, Dan Huggins b, John Braam b, Scott Koshowski b
a Department of Civil and Environmental Engineering, University of Western Ontario, London, Ontario N6A 5B9, Canada, City of London, London, Ontario, Canada
PH REQUIREMENTS OF FRESHWATER AQUATIC LIFE. Prepared by: Robertson Bryan Inc.
Managing High pH in Freshwater Ponds. Craig S.Tucker and Louis R. D’Abramo





Leave A Comment
You must be logged in to post a comment.